Trading is not just about strategy. Even if you have the best strategy, if you don’t follow discipline, that strategy has no real value in the market. In the stock market, there are thousands of strategies available. But the real question is not which strategy you are using—the real question is which strategy fits your trading style and which one you can execute consistently without breaking rules.
If you choose a strategy that aligns with your execution ability, it can become a true game-changer for your trading journey.
In today’s article, we will explore a powerful trend-following strategy called the 9 & 20 EMA Crossover Strategy.
When the market is in a strong trend, this strategy helps you identify clear entry and exit points, reducing confusion and improving decision-making speed.
Because there is a famous saying in trading:
“Trend is your friend.”
What is the 9 & 20 EMA Crossover Strategy
If you are not fully clear about EMA (Exponential Moving Average), you can first check a detailed article on EMA basics to understand it better before moving forward.
An EMA crossover happens when a shorter EMA crosses a longer EMA either upwards or downwards, indicating a possible change in market trend or momentum.
In this strategy, we use 9 EMA (fast EMA) and 20 EMA (slow EMA)
Bullish Crossover (Uptrend)
When the 9 EMA crosses above the 20 EMA, it indicates bullish momentum in the market.
This is considered an uptrend condition, and traders look for buying opportunities.
Bearish Crossover (Downtrend)
When the 9 EMA crosses below the 20 EMA, it shows bearish momentum.
This is considered a downtrend condition, and traders look for selling opportunities.
Simple Meaning of EMA Crossover
In simple terms, EMA crossover means a change in market direction or momentum when one moving average crosses another. Whenever this crossover happens, it signals that the market sentiment may be shifting from bullish to bearish.
As a trader, we use this signal to identify potential entry points and align our trades with the current trend.
How EMA Crossover Works in a Trending Market
Trend Identification Logic
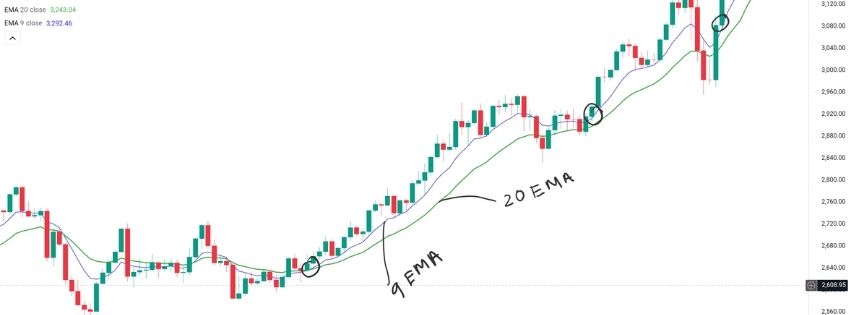
The primary function of an EMA crossover is to identify the market trend. In this strategy, the 9-period EMA acts as a fast-moving average that responds quickly to price changes, whereas the 20-period EMA serves as a slow-moving average that reflects the broader market trend. When both EMAs are plotted on a chart, their relationship provides a clear indication of the market’s direction.
If the 9 EMA continuously trades above the 20 EMA—or crosses above it and remains there—it signals that the market is in a bullish phase and buyers are in control. Under these conditions, the price structure also begins to form higher highs and higher lows, which confirms a strong uptrend.
Conversely, when the 9 EMA crosses below the 20 EMA and sustains that position, it indicates a bearish trend. In this scenario, sellers dominate, and the market forms lower highs and lower lows.
Strong Trend Confirmation (Pro Trader Trick)
To confirm a trend, professional traders employ a simple yet powerful method that further strengthens the EMA crossover signal.
In this method, we observe higher timeframes, such as the 1-hour and 4-hour charts. Merely observing the crossover is not sufficient; we verify whether the market is, in fact, following that specific trend.
If the price closes above the 20 EMA (especially with a green candle) on higher timeframes—such as the 1-hour or 4-hour charts—it serves as a strong indication that the market is in an uptrend phase and buyers are in control.
Conversely, if the price closes below the 20 EMA, it acts as a clear signal that the market is shifting into a downtrend and sellers are dominating.
Entry Rules for 9 & 20 EMA Crossover Strategy (3-Minute Chart + Multi-Timeframe Confirmation)
In this strategy, we execute the actual entry on a 3-minute timeframe; however, before making a decision, we confirm with higher timeframes to ensure the trade is of high probability.
First, we check the 1-hour and 4-hour timeframes. If the price is closing above the 20 EMA in both timeframes and green candles are forming, it indicates that the overall market is in a strong uptrend.
Following this trend confirmation, we switch to a lower timeframe (the 3-minute chart). Here, we observe that the price is undergoing a pullback near the support zone or the 20 EMA.
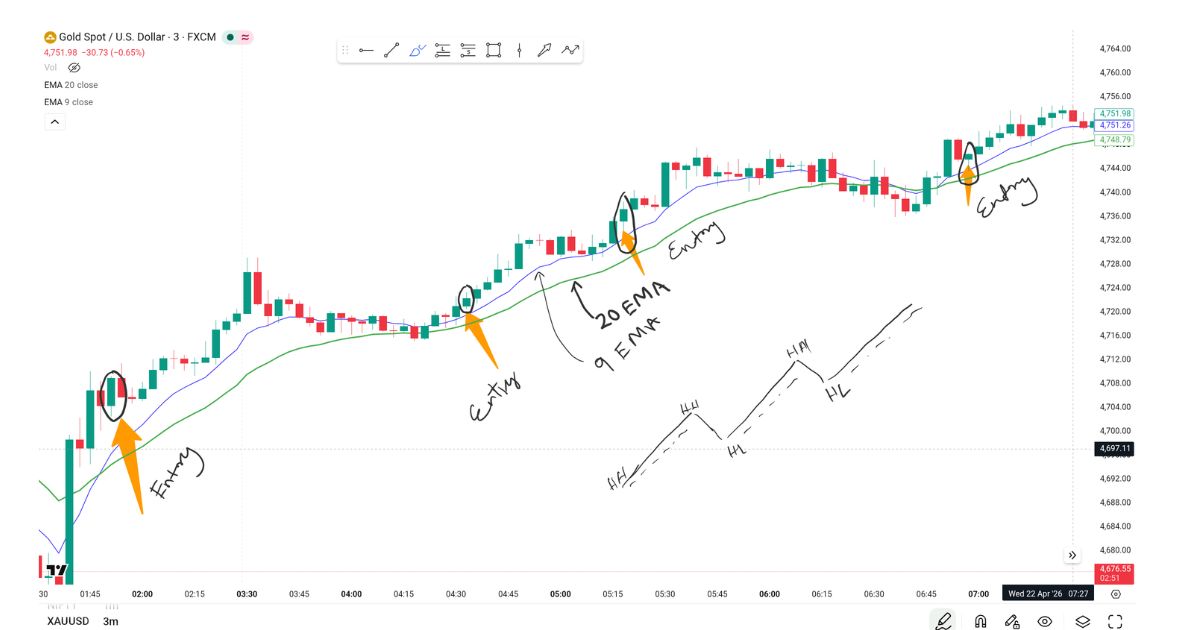
When the price bounces from that level and crosses above the 9 EMA, we receive the actual entry signal. This confirms that short-term momentum is also shifting towards the bullish side.
The image shared below is a 3-minute gold XSUUSD chart where a clear orange arrow is marked, showing the exact point from where we can take the entry.
9 & 20 EMA Crossover Strategy: Exit Rules and Risk Management Setup
Exit strategy is based on observing price action and EMA behavior. When price moves strongly in our favor after entry, we hold the trade until momentum starts weakening or price shows a reversal near key EMA levels. If price breaks back below the 9 EMA after entry in a long trade, it is a signal to book profits or exit. For short trades, if the price moves above the 9 EMA again, we consider exiting the position.
For risk management, we strictly risk only 1% of total capital per trade to protect our account from large losses. Stop-loss is placed based on recent structure or below/above the EMA zone, depending on the trade direction.
The risk-reward ratio is also very important in this strategy. We aim for 1:2, 1:3, or even 1:5 RR setups, where potential profit is multiple times higher than the risk taken. This ensures long-term consistency and profitability even if some trades fail.
Why the Trend Following Strategy Works Better for Intraday Traders
Trend-following strategies work better for intraday traders because they help traders align with the overall market momentum instead of fighting against it. In intraday trading, markets move quickly, and random entries often lead to losses due to noise and volatility. By following the trend, traders increase the probability of success as they are trading in the direction of strong market movement.
When the market is trending, price tends to respect moving averages like the 9 EMA and 20 EMA, making it easier to identify entry and exit points. This reduces confusion and helps traders avoid emotional decisions. Trend-following also allows traders to capture bigger moves with better risk-reward ratios, instead of taking frequent small and risky trades.
Common Mistakes Traders Make While Using the EMA Strategy
One of the most common mistakes traders make while using the EMA strategy is taking trades without proper trend confirmation. Many traders enter just because the 9 EMA crosses the 20 EMA, without checking higher timeframes like 1-hour or 4-hour, which often leads to false signals.
Another mistake is ignoring price action and blindly following the crossover. EMA is a lagging indicator, so without confirmation from candles and structure, entries can become inaccurate.
Traders also make the error of entering too early before the crossover is properly confirmed, or entering in a sideways (range) market where the EMA gives frequent fake signals.
Poor risk management is another major mistake—many traders risk too much capital in a single trade, which leads to large losses even if the strategy is correct.
I am sharing a YouTube video link with you. It will explain this strategy in detail. There is a slight difference between the strategy explained in the video and the one I have written, but I am sharing it so that you can gain more practical understanding and clarity from it.
Backtesting the Strategy Before Live Trading
Before using this strategy in the live market, it is very important to backtest it on historical data. Backtesting helps us understand how the 9 & 20 EMA crossover performs in different market conditions like trending, sideways, and volatile phases.
In backtesting, we check past charts and apply the same rules—higher timeframe trend confirmation, 9 EMA and 20 EMA crossover, and entry on a lower timeframe, like a 3-minute chart. This helps us identify how many winning trades and losing trades the strategy generates.
How to Combine Discipline with This Strategy for Consistency
This strategy only works properly when it is followed with strict discipline. Even if the setup is clear, without discipline, traders often overtrade or enter without proper confirmation, which leads to losses.
To maintain consistency, we must follow fixed rules every time—first confirm the trend on 1-hour and 4-hour charts, then wait for a proper 3-minute entry using 9 & 20 EMA crossover, and always respect stop-loss without hesitation. No emotional trading should be involved.
Discipline also means avoiding revenge trading, not increasing risk after losses, and sticking to only 1% risk per trade. When rules are followed consistently, the strategy becomes more reliable, and results become stable over time.
Importance of the “Trend is Your Friend” Concept
In trading, the most powerful concept is “Trend is your friend.” This means that instead of fighting the market direction, we should always trade in the direction of the trend. The EMA crossover strategy helps us identify this trend clearly using the 9 EMA and 20 EMA.
When we follow the trend, the probability of success increases because we are trading with the market momentum, not against it. In an uptrend, we focus only on buying opportunities, and in a downtrend, we focus only on selling opportunities. This simple rule helps reduce confusion and improve accuracy in trading decisions.
Final Thoughts: Strategy vs Discipline – What Actually Wins?
In trading, many people think that a powerful strategy is enough to become profitable, but the reality is different. Strategy gives you the setup, but discipline gives you the execution.
Even the best strategy, like the 9 & 20 EMA crossover, will fail if it is not followed with patience, proper risk management, and emotional control. On the other hand, a simple strategy can become highly profitable if it is followed with strict discipline.
So the real winner in trading is not just strategy or just discipline—it is discipline with a consistent strategy execution that creates long-term success in the market.
Disclaimer
This article is written based on my personal experience in the market, along with the help of AI for structuring and explanation. It is intended only for educational and informational purposes. The trading concepts and strategies shared here are not financial advice. Stock market trading involves risk, and losses can occur. You are solely responsible for your trading decisions. Always do your own research or consult a certified financial advisor before investing or trading.