

Gold is currently trading around 4728.40 at the time of writing this article. Due to ongoing tensions in the Middle East, gold has been trading within a broad range for quite some time, keeping traders and investors focused on the next major move. The big question now is whether gold will finally break out of this consolidation zone and start a fresh bullish rally, or continue trading sideways as uncertainty remains high in the global market. With geopolitical tensions still active, all eyes are now on gold’s next breakout direction.
Gold Price Technical Analysis
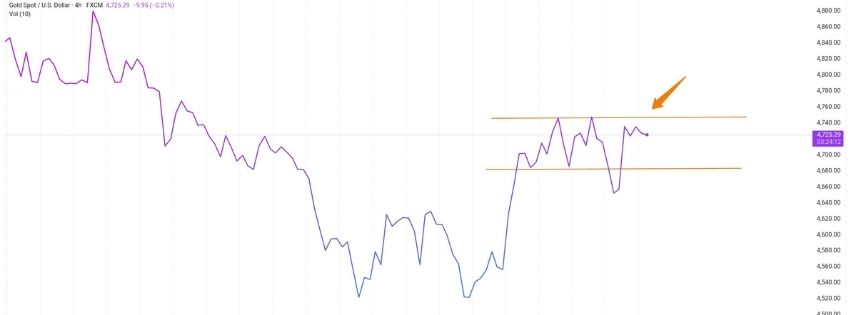
If we look at the daily timeframe, gold is currently trading within a range between support at $4682 and resistance at $4747. At the time of writing, the current market price is around $4740.
The price is currently trading above the 20 EMA, which indicates short-term positive momentum in the market. Meanwhile, the RSI is at 56.15, suggesting that the market still has mildly bullish strength while continuing to move in a sideways structure.
However, when looking at the volume, it remains below the 10-day moving average volume, indicating that the market still lacks strong participation for a confirmed breakout. This suggests that gold may continue trading within a range unless stronger momentum enters the market.
At the same time, the market has repeatedly attempted to break the $4747 resistance zone but is again pulling back after touching resistance levels. This price behavior indicates that sellers are still active near higher levels, which also reflects the possibility of short-term bearish pressure despite the current bullish momentum.
Gold Overall Outlook
Overall, gold is currently trading in a sideways-to-volatile structure, with global market sentiment heavily influenced by ongoing Middle East tensions and uncertainty in the broader financial market. On the technical side, gold is still holding above the 20 EMA on the daily timeframe, which reflects short-term bullish momentum. However, repeated
Rejection near the $4747 resistance zone shows that sellers remain active at higher levels.
The market is currently stuck between $4682 support and $4747 resistance, indicating that traders are waiting for a confirmed breakout before taking strong positions. A successful breakout above resistance could open the door for a fresh bullish rally, while a breakdown below support may shift momentum back toward the bearish side.
At the moment, gold continues to trade in a consolidation range, and the next major move will likely depend on volume strength, global geopolitical developments, and overall market sentiment.
Disclaimer
This article is for educational and informational purposes only and should not be considered financial or investment advice. Financial markets are subject to risk and volatility, especially during global economic and geopolitical events. Traders and investors should conduct their own research and risk management before making any trading decisions. The author and website are not responsible for any financial loss or investment outcome based on this analysis.
bank nifty bear trap Beginner’s Guide bitcoin bitcoin price discipline beats strategy. Discipline in Trading ema forex trading Gift Nifty gold Gold Analysis gold fourcast Gold Price Gold Price Analysis Gold Price Analysis: If This Support Breaks – Gold Could Drop Fast Gold Price Technical Analysis indian stock market intraday intraday trading In trading IPO IPO Details IPO Review 2026 ipo traps Minimum Money Required to Start Trading in India (Beginner’s Guide 2026) Nifty 50 nifty50 NIFTY Bank Prediction Nifty Bank Today precious metal rate trape Sensex Sensex Prediction stock market stock market today Stock Market Trading Basics stock to watch Support Breaks Today Analysis trading Trading for Beginners valu trapes XAUUSD XAUUSD Price