

Bitcoin has declined a nearly 25% in just one month. Panic grips the market. On social media, people are either talking about a crash or calling it a golden buying opportunity. After every correction, the same question arises – “Is this an opportunity to buy the dip, or is there still more downside left?”
If you’re a short-term trader, volatility can be an opportunity for you. But if you’re a long-term investor, this can be complicated for you as to whether the price will bounce back or continue its downtrend.
History tells us that 20–30% corrections are nothing new in Bitcoin. Such pullbacks have occurred frequently, even during bull markets. But not every correction is the same. Some corrections turn into accumulation phases, while others become the start of major downtrends.
In this article, we will try to understand this based on data and technical analysis, leaving emotional reactions aside:
Why Did Bitcoin Fall 25%?
No correction happens without reason. A few possible factors could be behind Bitcoin’s recent decline:
- Global risk-off sentiment (stock market weakness)
- US interest rate concerns and News
- ETF inflows is slowdown
- Profit booking by whales
- Overleveraged futures positions ka liquidation
The crypto market is highly sentiment-driven. When funding rates rise, and retail traders take heavily long positions, the market liquidates them. This 25% drop may also be a process of partly shaking out leveraged traders.
Bitcoin Technical Analysis – Bigger Time Frame View
Look at the technical analysis, the momentum will remain for the short term, but in the long term, something which seems a bit complicated to us, we will analyze that only. I do the analysis on TradingView, and here I have selected a weekly time frame, and along with that, I am using a 30 EMA.
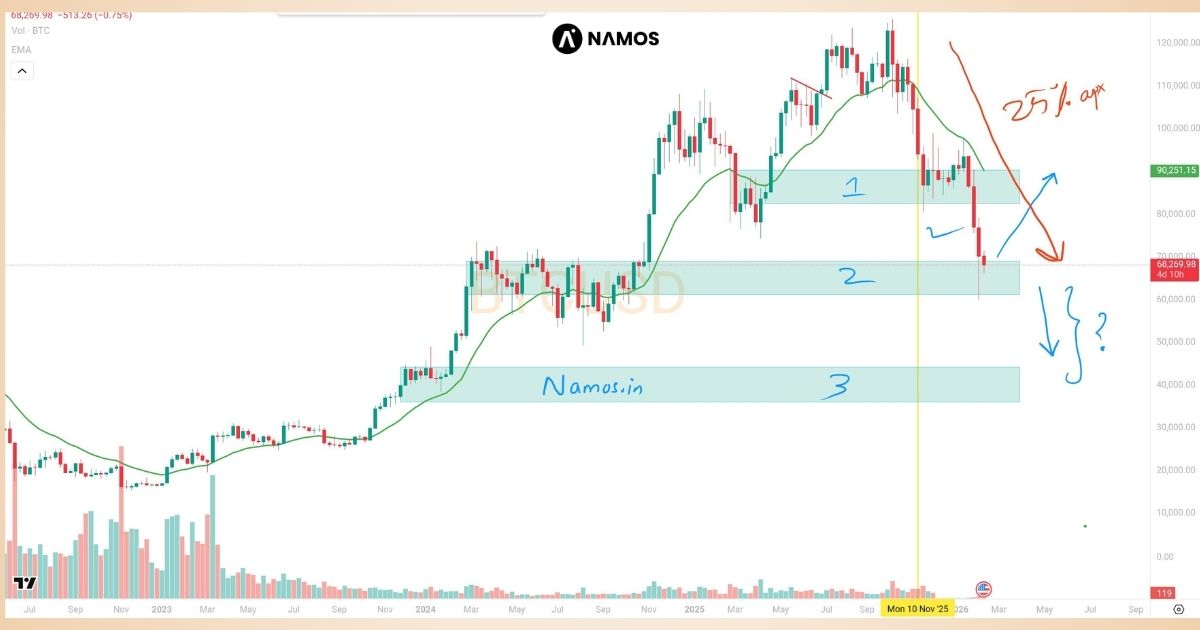
If you look carefully at the chart, I have drawn some lines which I have named 1, 2, and 3. From the time when a bull run started in Bitcoin after 2023 till then, when Bitcoin price is falling, you can see on the right side that Bitcoin has fallen by 25% and the price is at 68.2694.98, which is in a consolidated sideways zone. If Bitcoin falls by a thousand points from here, then somewhere it may hit this price, which is 40000.
If we look at Bitcoin from a technical point of view, that is, the RSI. The RSI is currently trading at 21.76 on the weekly timeframe. This is a strong signal that the market could move lower. However, some traders believe that when the market reaches below 20 or 30, the probability of an uptrend increases. However, this is not the case in my analysis. As long as the market is at a low, the probability of a low is very high. We cannot consider it an uptrend until it crosses the low and moves higher. However, we can also say that it is in a sideways zone.
Due to such a big bull run, the market had to come down somewhere and when the market comes down, it gains a lot of speed and on top of that, according to the news that has been created in America and the situation of the market, Bitcoin is expected to fall even faster, right now the price at which Bitcoin is trading is 68,269.98, if Bitcoin comes down by a thousand points in this price, then somewhere or the other Bitcoin will definitely touch the third line, which technical analysis is showing that it will touch price 40000, Bitcoin can go sideways.
Final Verdict – Bounce or Downtrend?
Bitcoin is currently positioned at a crucial zone. If strong support holds and bullish confirmation is received, the probability of a bounce is strong.
But if the structure breaks and the price sustains below the 200 EMA, the downtrend could continue. Professional traders don’t make predictions—they wait for confirmation.
So the best approach is:
- Mark a clear level.
- Wait for confirmation.
- Manage risk.
- Don’t make emotional decisions.
Bitcoin always offers volatility. The question isn’t whether the market will go up or down. The question is whether you’re prepared.