In the field of technical analysis, the Relative Strength Index (RSI) has always played a very important role. It is one of the most trusted and widely used indicators among traders worldwide.
I have personally used RSI for the past 4 years and have observed that many professional traders and even large financial institutions place a high priority on this indicator. Because of its simplicity and reliability, RSI has become a favorite tool for many market participants.
In my opinion, if there is one indicator that provides the most balanced view of market momentum, it is RSI.
Whether you are doing intraday trading, swing trading, or even long-term investing, RSI can give you valuable insights into the market. It helps traders understand the strength of price movement and provides signals about potential entry and exit points. The main reason traders use RSI is to understand the momentum and strength of the market. It helps answer important questions such as:
- Is the market strong or weak?
- Is the price overbought or oversold?
- Is it the right time to enter a trade or exit a position?
In this article, we will completely explore the RSI indicator. We will understand how it works, the underlying formula, the optimal timeframes and settings, and how traders use RSI strategies for both intraday and swing trading.
By the end of this guide, you will have a clear understanding of how RSI can help you make more informed trading decisions.
RSI Full Form and Meaning
The full form of RSI is Relative Strength Index.
It is a momentum indicator that measures the speed and strength of price movements in a stock or asset. RSI ranges from 0 to 100 and helps traders determine whether the market is overbought or oversold.
In simple terms, RSI shows whether buyers are stronger or sellers are stronger in the market.
Who Created the RSI Indicator?
The Relative Strength Index was developed by J. Welles Wilder Jr., a famous technical analyst and mechanical engineer.
He introduced the RSI indicator in his famous book: New Concepts in Technical Trading Systems
The book was published in 1978 and introduced several technical indicators that traders still use today. Even after decades, RSI remains one of the most reliable momentum indicators in technical analysis.
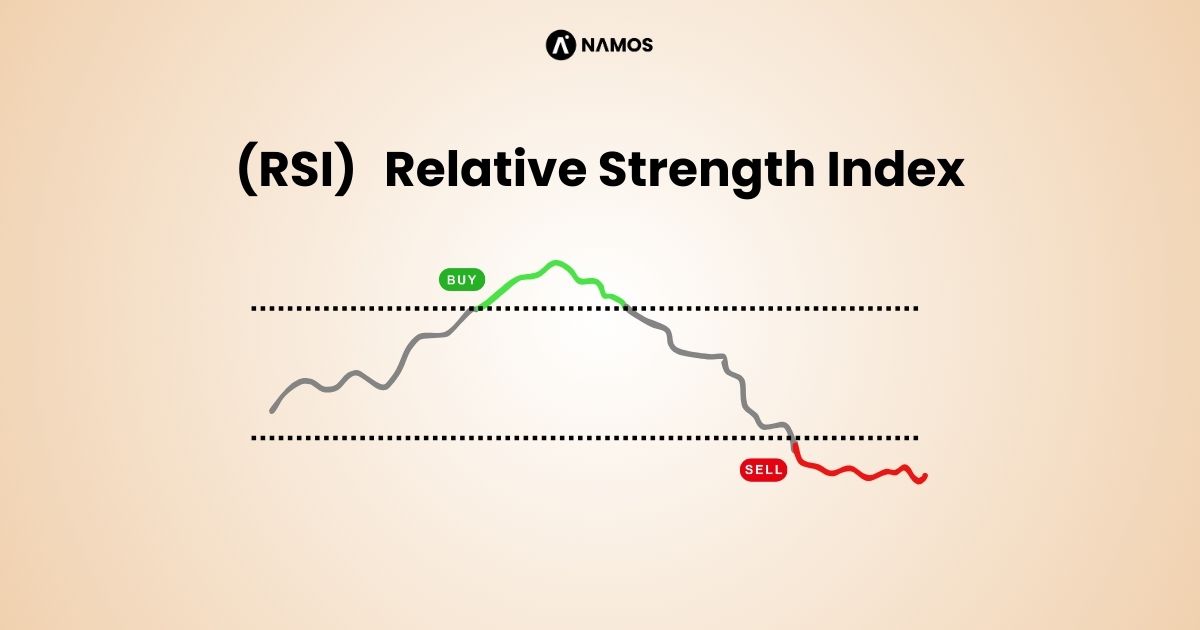
How the RSI Indicator Works
RSI compares the magnitude of recent price gains with recent price losses to determine momentum.
- When buying pressure increases, RSI moves higher.
- When selling pressure increases, RSI moves lower.
The indicator oscillates between 0 and 100 and typically uses two key levels:
- 70 level
- 30 level
These levels help traders understand market conditions.
RSI Overbought and Oversold Levels
The Relative Strength Index (RSI) moves between 0 and 100 and helps traders understand whether the market is currently overbought, oversold, or moving within a normal range.
- By default, most trading platforms use the 70 and 30 levels to identify these conditions.
Default RSI Levels
- Above 70 → Overbought condition
- Below 30 → Oversold condition
- When RSI moves above 70, it usually means the price has risen strongly and may face a temporary pullback or consolidation.
- When RSI drops below 30, it suggests the price has fallen significantly, and a bounce or recovery may occur.
However, these levels should not be used blindly to enter trades. In strong trends, the RSI can stay in overbought or oversold zones for a long time.
My Preferred RSI Levels: 60 and 40
Personally, I recommend using 60 and 40 levels to understand the market structure and trend strength.
These levels often provide a clearer picture of the market direction.
- RSI above 60 → The market is considered to be in an uptrend
- RSI below 40 → The market is considered to be in a downtrend
- RSI between 40 and 60 → The market is usually sideways or range-bound
Using these levels helps traders quickly identify the overall momentum of the market.
Important Note for Traders
The 60–40 RSI zone is mainly useful for understanding market structure, not for direct trade entries.
To take a proper trade, RSI should be combined with other tools such as:
- Price action
- Support and resistance levels
- Trend confirmation
- Other technical indicators
When RSI is used together with these tools, the accuracy of trading decisions can improve significantly.
In short, RSI helps you understand market strength and direction, but successful trading requires confirmation from multiple factors.
RSI Indicator Formula
The formula used to calculate RSI is based on the average gains and losses over a specific time period.
RSI = 100 − (100 / (1 + RS))
Where:
RS = Average Gain ÷ Average Loss
This formula converts price momentum into a number between 0 and 100, making it easier for traders to analyze strength and weakness in the market.
Although the formula may look technical, modern trading platforms automatically calculate RSI, so traders only need to interpret the signals.
Best RSI Settings for Trading
The default RSI setting used by most traders is 14 periods.
This means the indicator calculates the average gain and loss over the last 14 candles.
However, different trading styles may use slightly different RSI settings.
Common RSI Settings
- RSI 14 – Standard setting used by most traders.
- RSI 9 – Faster signals for short-term trading.
- RSI 21 – Smoother signals for swing trading.
For beginners, the standard RSI 14 works very well.
Best Time Frame for RSI
RSI works on all time frames, but some time frames provide more reliable signals depending on your trading style.
For Intraday Trading
Common RSI time frames include:
- 5-minute chart
- 15-minute chart
- 30-minute chart
These help traders capture short-term price movements.
For Swing Trading
Swing traders usually use:
- 1-hour chart
- 4-hour chart
- Daily chart
These time frames capture medium-term trends.
The key idea is to match your RSI time frame with your trading style.
RSI Indicator (60–40 Strategy) for Intraday Trading
The Relative Strength Index (RSI) can be used in many ways, but one of the most practical approaches for intraday trading is the 60–40 RSI strategy. This method helps traders first understand the market trend and then look for precise entry opportunities.
The idea behind this strategy is simple: first identify the main trend using RSI levels, and then take entries when momentum confirms the move.
Step 1: Identify the Main Trend
The first step is to identify the overall market trend using the 60–40 RSI levels.
- When RSI stays above 60, the market is considered to be in a bullish trend. In this situation, traders should mainly look for buy opportunities.
- When RSI stays below 40, the market is considered to be in a bearish trend. In this case, traders should focus on selling opportunities.
- When RSI moves between 40 and 60, the market is usually sideways, and it is better to avoid aggressive trading.
This step helps traders align themselves with the overall market direction.
Step 2: Wait for Pullback Using 20 EMA
After identifying the trend, the next step is to wait for a small pullback and use a faster RSI setting, like 20 EMA, to find entry points.
For example, if the larger trend shows RSI above 60, it means the market is bullish. During this trend, if the 20 EMA temporarily drops and then starts moving upward again, it can signal a potential buy entry.
This approach allows traders to enter trades during pullbacks instead of chasing the market.
Important Rule
The 60–40 RSI levels help identify the trend, while the 20 EMA helps refine the entry timing.
However, traders should still combine this approach with other tools such as:
- Support and resistance
- Price action confirmation
- Proper risk management
Using these confirmations together can significantly improve the accuracy of intraday trading decisions.
Advantages of the RSI Indicator
The RSI indicator has several benefits that make it popular among traders.
First, it is easy to understand even for beginners.
Second, it helps identify momentum shifts in the market.
Third, it works on almost all markets, including stocks, forex, and cryptocurrencies.
Finally, RSI works well when combined with other tools like moving averages or support and resistance levels.
RSI Divergence With a Simple Example
Another important concept in the Relative Strength Index (RSI) is RSI divergence. Divergence simply means that price and RSI are not moving in the same direction. When this happens, it often shows that the current trend is getting weak and the market may change direction soon.
However, instead of using divergence alone, it becomes much more useful when we combine it with the 60–40 RSI trend strategy.
First, we understand the trend using 60 and 40 levels, and then we use divergence to get better trade confirmation.
Bullish Divergence (Buy Opportunity)
A bullish divergence happens when the price makes a lower low, but the RSI makes a higher low.
This means the price is still falling, but the selling pressure is getting weaker.
Simple Example
Imagine a stock is falling.
- First low price: ₹100
- Second low price: ₹95
So price made a lower low.
But when you check the RSI:
- First RSI low: 35
- Second RSI low: 42
Here, RSI made a higher low. This is called bullish divergence.
Bearish Divergence (Sell Opportunity)
A bearish divergence happens when the price makes a higher high, but the RSI makes a lower high.
This shows that although the price is rising, the buying momentum is becoming weaker.
Simple Example
Imagine a stock is rising.
- First high price: ₹200
- Second high price: ₹210
Price made a higher high.
But RSI shows:
- First RSI high: 72
- Second RSI high: 65
Here, RSI made a lower high. This is called bearish divergence.
Important Teaching Point
Always remember one rule:
- RSI 60–40 levels help you understand the trend.
- RSI divergence helps you understand when the trend may change.
When both signals appear together with support or resistance, the probability of a good trade becomes much higher.
This is why many experienced traders combine trend analysis, RSI levels, and divergence instead of relying on only one signal.
Conclusion
In this article, we tried to understand the Relative Strength Index (RSI) completely and practically. From its meaning and formula to its settings, strategies, and real trading use, we covered how this indicator can help traders read market momentum more clearly.
The RSI indicator was created by J. Welles Wilder Jr., and even today, it remains one of the most widely used indicators in technical analysis. The reason is simple — it helps traders understand market strength, momentum, and possible turning points.
We discussed the default RSI levels (70 and 30), which help identify overbought and oversold conditions. But we also explored a more practical approach using the 60–40 RSI levels. These levels help traders quickly understand the overall market structure:
- When RSI stays above 60, the market usually shows bullish strength.
- When RSI stays below 40, the market usually shows bearish strength.
- When RSI moves between 40 and 60, the market often becomes sideways.
This simple structure helps traders align themselves with the correct market direction instead of trading randomly.
We also discussed how RSI can be used in intraday trading and swing trading. By combining the 60–40 trend understanding with faster RSI settings like RSI 9, traders can identify pullbacks and better entry points within the trend.
Another important concept we covered was RSI divergence. Divergence occurs when the price and RSI move in opposite directions, which can signal that the current trend is losing strength. When divergence appears near important support or resistance levels, it can give traders an early warning of a potential market reversal.
However, the most important lesson is this: RSI should not be used alone. Like any indicator, it works best when combined with price action, support and resistance, and proper risk management.
Indicators give signals, but discipline and strategy create consistency.
If traders learn to read RSI calmly and combine it with market structure, it can become a very powerful tool for identifying high-probability trading opportunities.