Many traders use TradingView every day—whether it’s for chart analysis or learning something new about trading. But the reality is, most traders are not using TradingView to its full potential.
There are several hidden Features inside TradingView that can significantly improve both your analysis and overall trading performance, yet many traders are not aware of them.
That’s why in this article, we will discuss the Top 7 TradingView Features that That 90% Traders Don’t Know – but once you start using them, they can boost your trading efficiency and give you a better edge in the market.
Top 7 TradingView Features
Most traders only use basic features on TradingView, but it has many powerful hidden tools that can improve your analysis and trading. Let’s explore the top 7 features that can give you an edge.
- Seasonality
- Micro Map
- Fundamental Graphs
- Bloomberg Index
- Document
- Unlimited Free Watchlist
- Blog Article (Community Ideas)
1. Seasonality
Seasonality is a very powerful feature, especially for commodities and equity markets. Most traders only focus on the chart’s price (Y-axis), but they ignore another important factor—the time (X-axis).
With seasonality, you can understand how long it usually takes for a stock or commodity to move from one price to another, and how it performs during different months of the year. It helps you see yearly patterns, cycles, and recurring trends in the market.
To analyze all these factors, TradingView has introduced a powerful feature called Seasonality, which allows traders to study time-based behavior and make better decisions.
I have shared the seasonal performance of gold with you. To access this on TradingView, go to the home page and click on the Search button, then type Gold. After that, click on the symbol/source.
Once you open it, you will see the chart section. There, you’ll find an option called “Seasonality.” Click on it, and you will get the complete seasonal history of gold, showing how it has performed over different time periods.
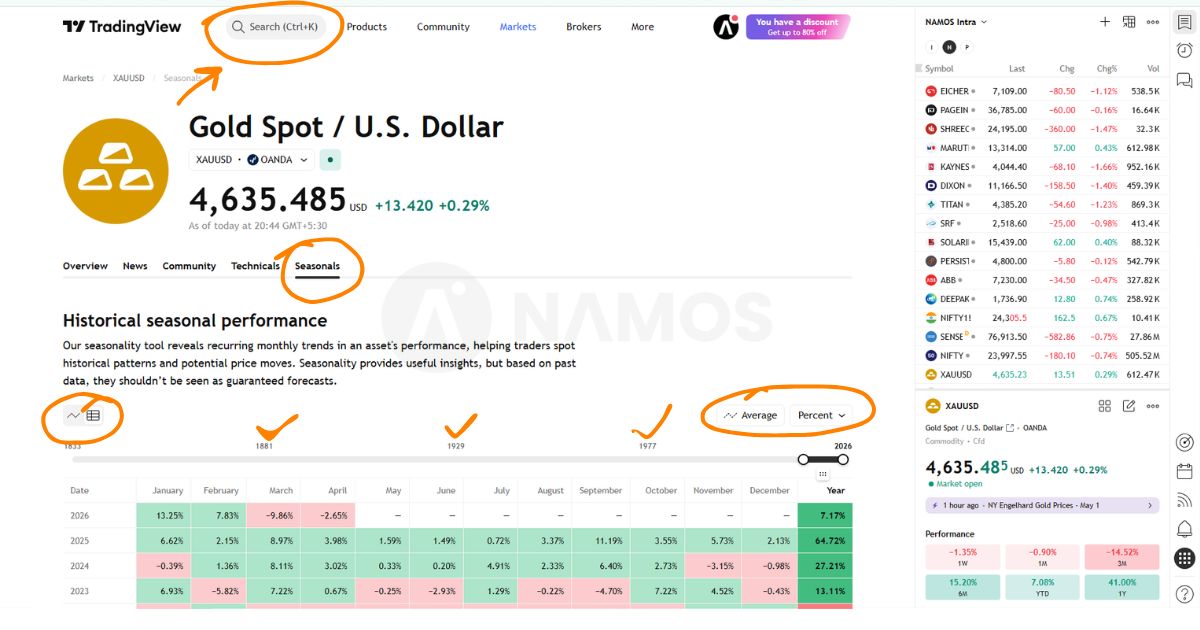
In the image I shared, I have highlighted the important details in orange, so if you observe, you will understand it easily. On the TradingView page, you will see a section that includes both a chart and a table. I specifically shared the table view because it makes the data much clearer and easier to understand.
With this, you can analyze how gold has performed over the past years—how much return it has given annually, and how it performs in different months. This gives you a complete view of its seasonal behavior.
Based on this data, you can plan your trading and investing strategy more effectively, because now you have both clear data and visual confirmation over time.
9-20 EMA Crossover Strategy Can Change Your Trading Game Forever
2. Micro Map
The Micro Map feature shows a global map view where you can analyze the financial condition of different countries in one place. You can check important data like inflation rate, interest rates, GDP, and unemployment rate for each country.
All this information is available on a single screen, and you can click on any country to see its specific data. The platform displays the latest available data based on yearly updates, helping you understand the global economic situation clearly.
If you double-click on any country, TradingView will open its detailed chart view, where you can analyze that market further.
In simple terms, Micro Map allows you to view and compare the entire world’s financial data on one map, making global analysis much easier.
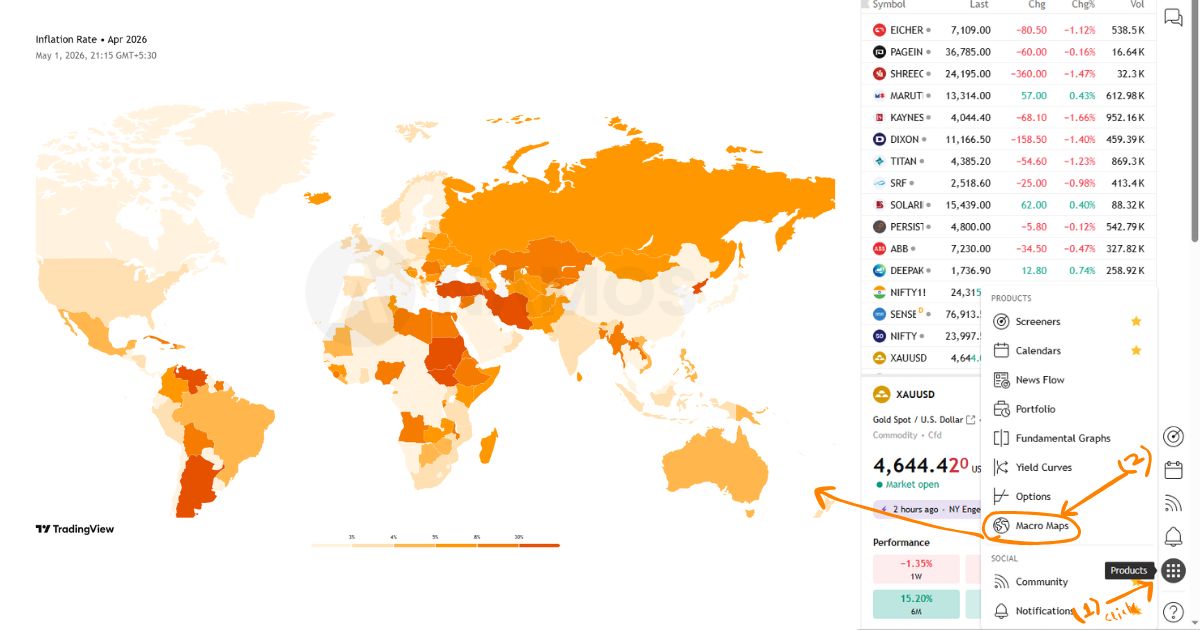
I have already shared an image with you—if you observe it, you will clearly understand how the Micro Map works and how the data is presented.
3. Fundamental Graphs
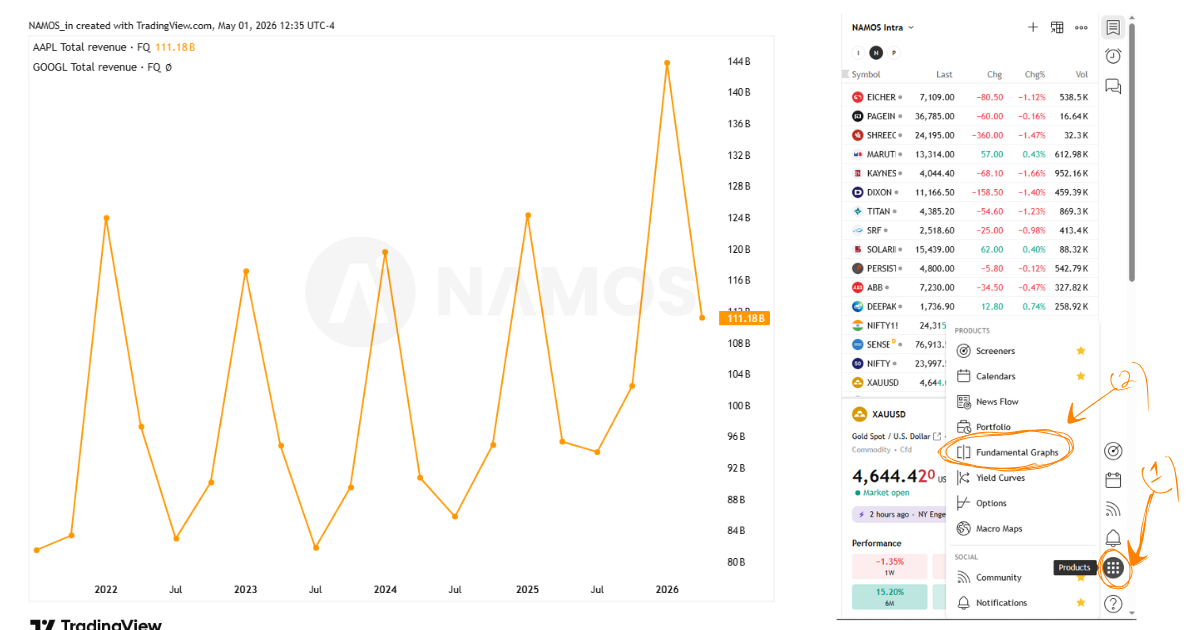
With Fundamental Graphs, you can analyze a company’s financial data directly on TradingView. You can even compare two companies side by side by adding them together and checking key metrics like the P/E ratio, revenue, profit, and growth.
This feature gives you a clear visual understanding of a company’s performance. You can also explore details like the balance sheet, income statement, and statistics, all in one place.
In simple terms, it helps you understand the true strength of a company, making it a must-know feature for every trader and investor.
4. Bloomberg Index
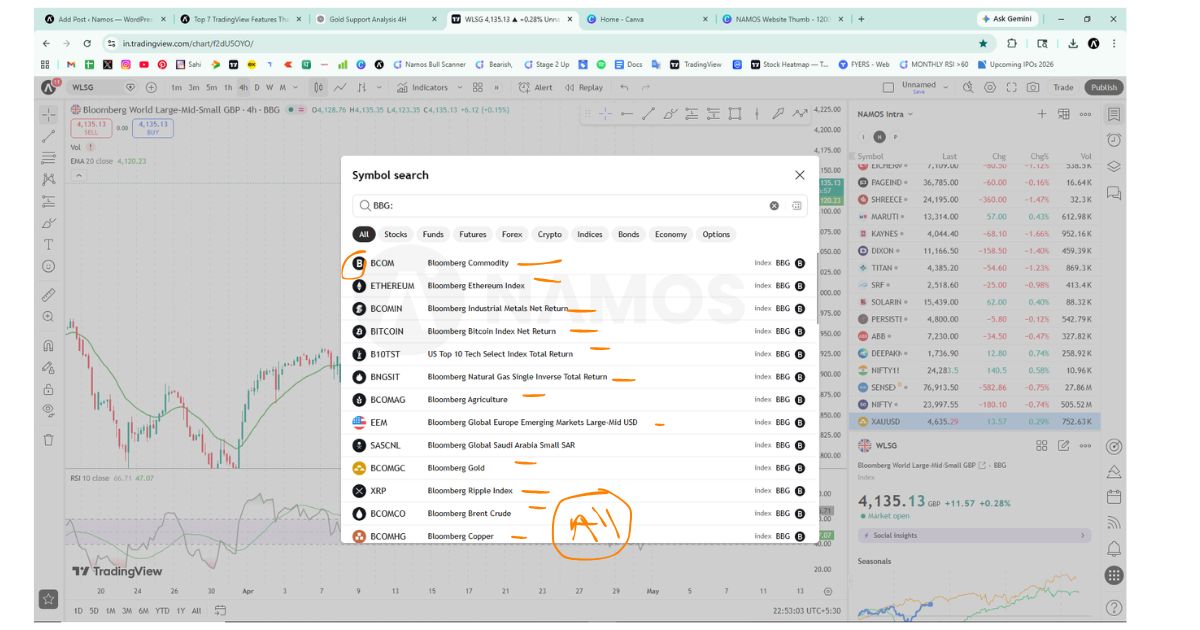
Now let’s talk about the Bloomberg Index feature. TradingView has partnered with Bloomberg, which is widely known for providing high-quality institutional data through its Bloomberg Terminal—usually very expensive and used by professional investors.
Through this integration, TradingView gives you access to a wide range of Bloomberg indices, which are popular among traders for tracking different markets and sectors.
To use this feature, go to the TradingView search bar and type “BBG:”. You will see a large number of Bloomberg-related indices.
In fact, you can access thousands of indices (10,000+) for free directly on TradingView.
In simple terms, this feature allows you to use institutional-level data and indices without paying for the Bloomberg Terminal.
5. Document
The Document feature on TradingView is very useful for every investor. Normally, if you want to check a company’s documents, you have to visit the exchange website or the company’s official site. But TradingView has made this process much easier.
You need to search for the company name on TradingView, go to its main page, and click on the “All” section, where you will find the Documents option.
Here, you can access important company documents, including financial reports, filings, and other key information for investing.
In simple terms, this feature helps you gain strong fundamental knowledge about a company without visiting multiple websites, making your research faster and more efficient.
6. Creating a Free Watchlist
On TradingView, creating multiple watchlists is usually limited in the free version, but there is a simple way to manage it without a premium plan.
You can log in to your TradingView mobile app, go to the Watchlist section, and select the option to create a new watchlist. From there, you can organize and manage your stocks easily.
In simple terms, by using the mobile app smartly, you can create and manage watchlists for free, helping you track different stocks and setups without needing a paid plan.
7. Blog Articles (Community Ideas)
TradingView has a built-in community section where traders share blog posts, analysis, and trading strategies. Many users regularly post market insights and ideas, which can help you understand different perspectives and improve your decision-making.
This gives you access to valuable market information and real-time ideas, helping you find better trading and investing setups. You can also share your own analysis and strategies with others, making it a powerful learning and networking platform for traders.
Conclusion
In this article, we explored the Top 7 TradingView hacks that most traders are not aware of, yet they can significantly improve both analysis and decision-making. From seasonality, which helps you understand time-based market behavior, to Micro Map for global economic insights, and fundamental graphs for deep company analysis, each feature adds a different layer of understanding to your trading.
We also saw how Bloomberg indices bring institutional-level data to your screen, the document feature makes company research easier, and how you can create and manage watchlists for free. Along with that, the community blog section allows you to learn from other traders and even share your own ideas.
The main idea is that TradingView is not just a charting platform—it is a complete ecosystem for traders and investors. If you use these features properly, you can gain better clarity, save time, and improve your overall trading performance.