
In Friday trading session, Nifty 50 closed around 24,176, falling by 150.50 points (-0.62%), indicating selling pressure in the market. Similarly, BSE Sensex ended near 77,328, declining by nearly 516 points (-0.66%).
Overall, both major Indian benchmark indices closed with a decline of around 0.60%, reflecting weak market sentiment during Friday’s session.
Nifty 50 Prediction Today
In the Friday trading session, Nifty 50 closed around 24,176, falling by 150.50 points (-0.62%), reflecting mild selling pressure in the market.
From a technical perspective, the index is currently trading within a range-bound structure. The important support level is near 23,800, while 24,300 is acting as a key resistance zone.
Talking about moving averages, Nifty 50 is still trading above the 20 EMA, but the market closed with a red candle during the Friday session, showing weakness near higher levels.
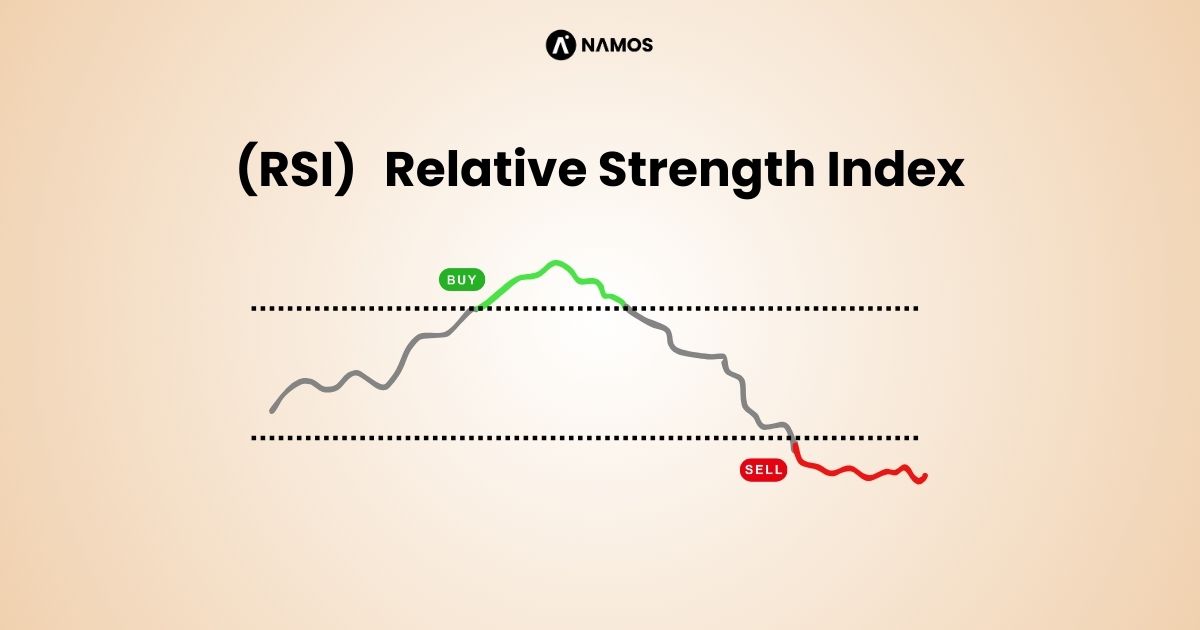
If we look at volume activity, the volume remains below the 5-day moving average, indicating a lack of strong participation from buyers. The RSI is around 53.8, which suggests the market is still moving in a sideways range on the daily time frame.
Meanwhile, the index is still trading below the 200 EMA, which keeps the broader trend slightly cautious.
BSE Sensex Prediction Today
In the Friday trading session, the BSE Sensex closed around 77,328, falling by nearly 516 points (-0.66%), indicating weakness in the broader market.
From a technical perspective, the BSE Sensex is also reacting similarly to the Nifty 50 and is currently trading within a sideways range between important support and resistance levels.
Support: 76,000
Resistance: 78,700
The market closed near the 20 EMA with a red candle, which reflects a sideways to slightly bearish structure.
If we look at trading activity, the volume is also below the 5-day moving average, indicating weaker participation from buyers. On the broader daily time frame, the index is still trading below the 200 EMA, which suggests the market remains in a long-term weak-to-sideways trend.
The RSI is around 50.34, once again indicating a neutral sideways market condition without strong momentum in either direction.
NIFTY Bank Prediction Today
In the Friday trading session, NIFTY Bank closed around 55,315, falling by nearly 736.85 points (-1.31%), indicating strong selling pressure in the banking sector.
From a technical perspective, NIFTY Bank is currently trading within a range-bound structure.
Support Level: 54,600
Resistance Level: 56,200
At present, the price is moving between these important levels, showing no clear breakout direction yet.
On the daily time frame, the index is trading below the 200 EMA, which reflects a broader weak-to-sideways trend. In Friday’s session, the market closed with a red candle, indicating bearish pressure near higher levels.
If we look at volume activity, the volume remains above the 10-day moving average, suggesting active participation in the market despite the weakness.
The RSI is around 48.21, which once again signals a sideways market condition with slight downside pressure.

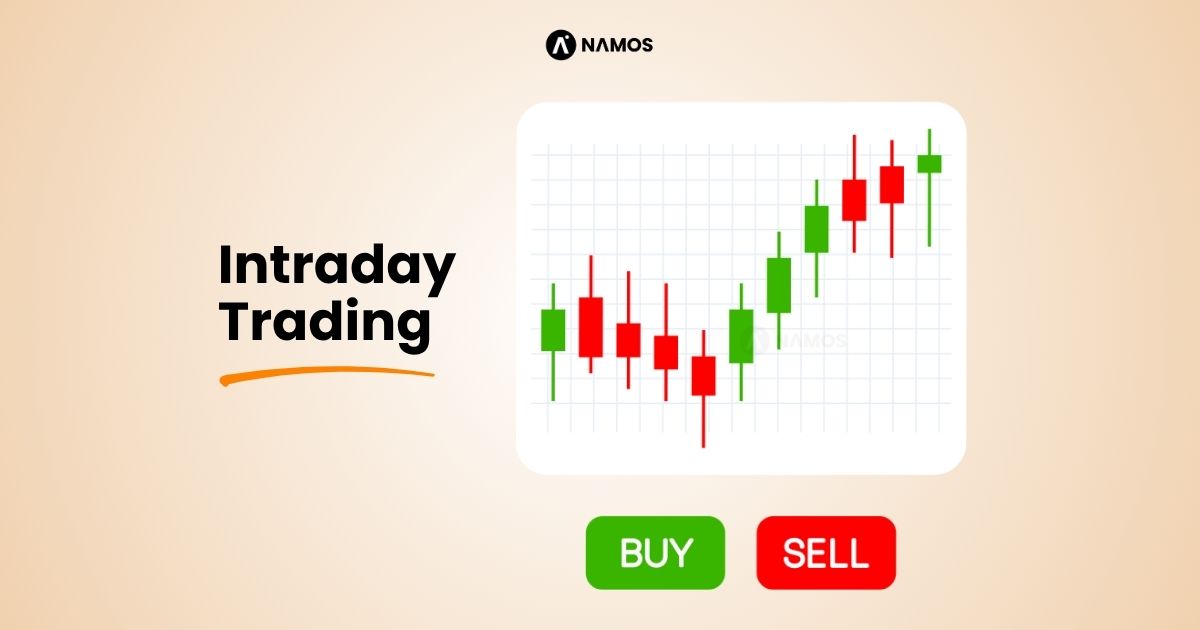
Stocks to Watch for Intraday Trading
If the overall index remains in a downtrend or sideways structure, traders should mainly focus on following the index trend before taking any intraday positions. Your trading setup should always move according to the direction of Nifty 50 and BSE Sensex.
For today’s intraday watchlist, traders can keep an eye on:
Shree Cement Ltd
Maruti Suzuki India Ltd
Kaynes Technology India Ltd
Dixon Technologies (India) Ltd
SRF Ltd
Overall Market Outlook
The overall Indian market is currently showing a sideways to slightly bearish structure, with both Nifty 50 and BSE Sensex trading near important support and resistance zones.
On the higher time frame, the market is still lacking strong directional momentum, while lower time frames continue to show volatility and range-bound movement. Banking stocks are also facing pressure, which is keeping the broader market slightly weak.
At the same time, selective sectors such as auto, cement, electronics, and chemicals are showing stock-specific momentum, which may continue to provide intraday opportunities even if the index remains sideways.
Disclaimer
All market views shared in this article on namos.in are based on technical analysis, chart structure, RSI behavior, EMA positioning, and market momentum observations.
Stock market trading involves risk, and market conditions can change quickly due to news events, global sentiment, or volatility. The analysis shared here is only for educational and informational purposes and should not be treated as direct financial advice.
Readers should use proper risk management and trade according to their own research and strategy. namos.in and the content author are not liable for any profit, loss, or trading decision made based on this analysis.