Most traders explain support and resistance in a very short way, which makes people ignore how important it really is in live trading. Today, we are going to change that.
In This Guide
In this Support and Resistance Simple Guide, we will explain support and resistance clearly and practically. You will learn how to draw support and resistance zones correctly, which candles to consider, and how real traders use these levels in the market. Along with that, we will also share some actionable strategies and show you how you can use support and resistance to improve your trading accuracy and profitability.
The key idea is: we don’t draw randomly. We observe where the price has taken support (bounced up) and where it has faced rejection (fallen), and then mark those levels clearly on the chart.
Support and Resistance Example:
If a stock touches ₹100 multiple times and goes up from there, you draw a horizontal line at ₹100 — that becomes support.
If it touches ₹120 multiple times and falls, you draw a horizontal line at ₹120 — that becomes resistance.
Support and Resistance Breakdown (In Detail)
- Support Level
Support and resistance are very old and powerful price action concepts, and many professional traders still use them because it works on pure market behavior. It is one of the most popular tools in technical trading.
Now the main question is whether support and resistance are just drawing a line?
The answer is No.
Support is not just a random line. It is a level where price comes again and again, stops falling, and bounces back up. This happens because at that level, the probability of buyers becomes higher, and demand increases. When the price touches that level and moves upward, we call that level support.
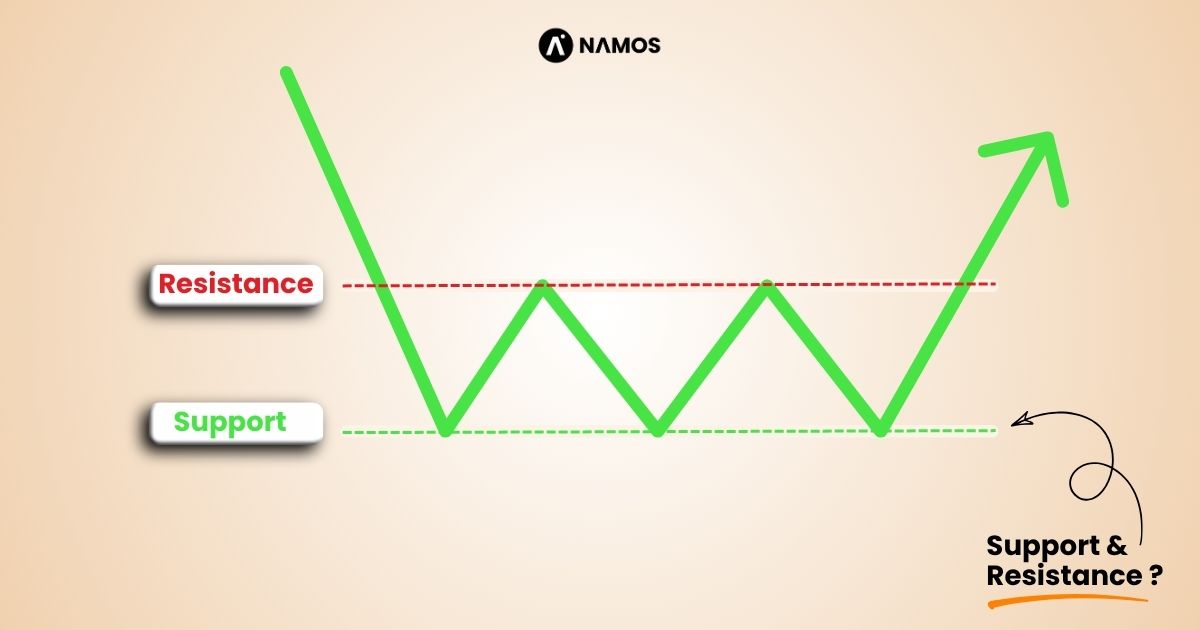
As you can see in the image, a simple line chart is used instead of candles for clarity. Below that, an orange horizontal line is drawn, and arrows mark the exact points where the price is taking support.
If you observe closely, every time the price reaches this level, it finds support and moves upward. This clearly shows that in this area, there are more buyers (demand) than sellers, which is why the price keeps bouncing back from the same zone.
So, when we connect all these price reaction points and draw a single horizontal line, that line becomes our support level.
- Resistance level
Resistance is just the opposite of support. It is a level where the price goes up, but sellers become active, and the price starts falling from that point. In simple terms, at this level, selling pressure is higher than buying, which is why the price struggles to move up and keeps coming down after touching that level again and again.
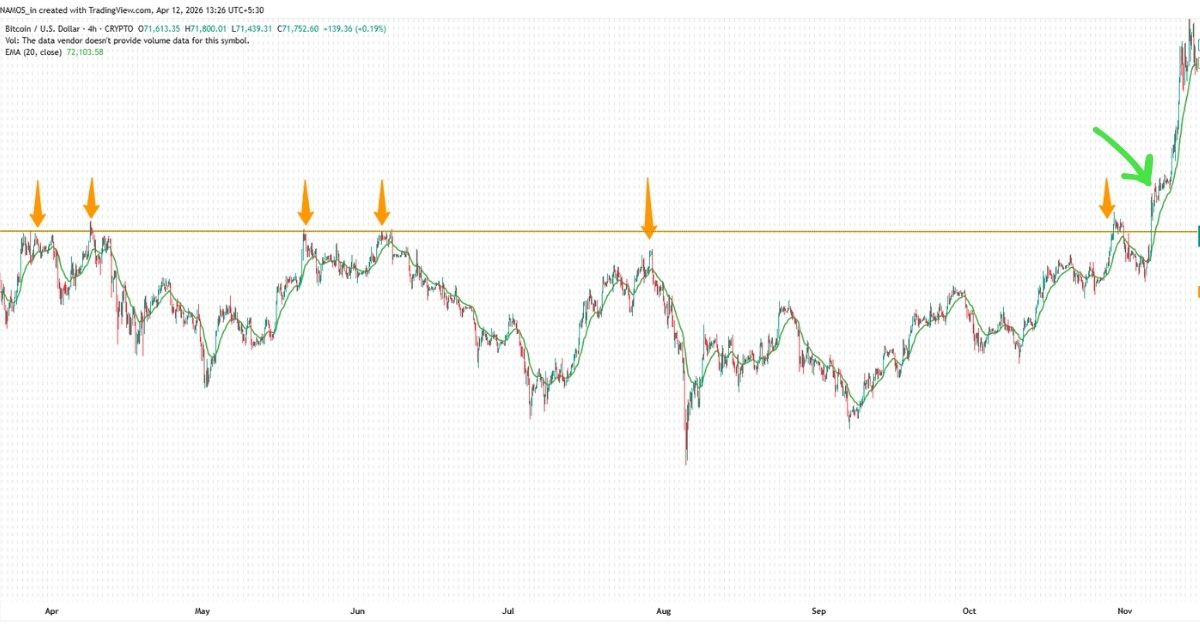
After understanding this, look at the image you shared. If you observe, the points where the price moved down are clearly marked as resistance levels. I also marked a big green arrow on the right side, where the price breaks the resistance — this is called a breakout. After the breakout, the market can create a new resistance and a new support, and then the price may move in a range between these levels.
These repeated reactions, breakouts, and formations are what we call support and resistance behavior in the market.
- Important Note: S&R level
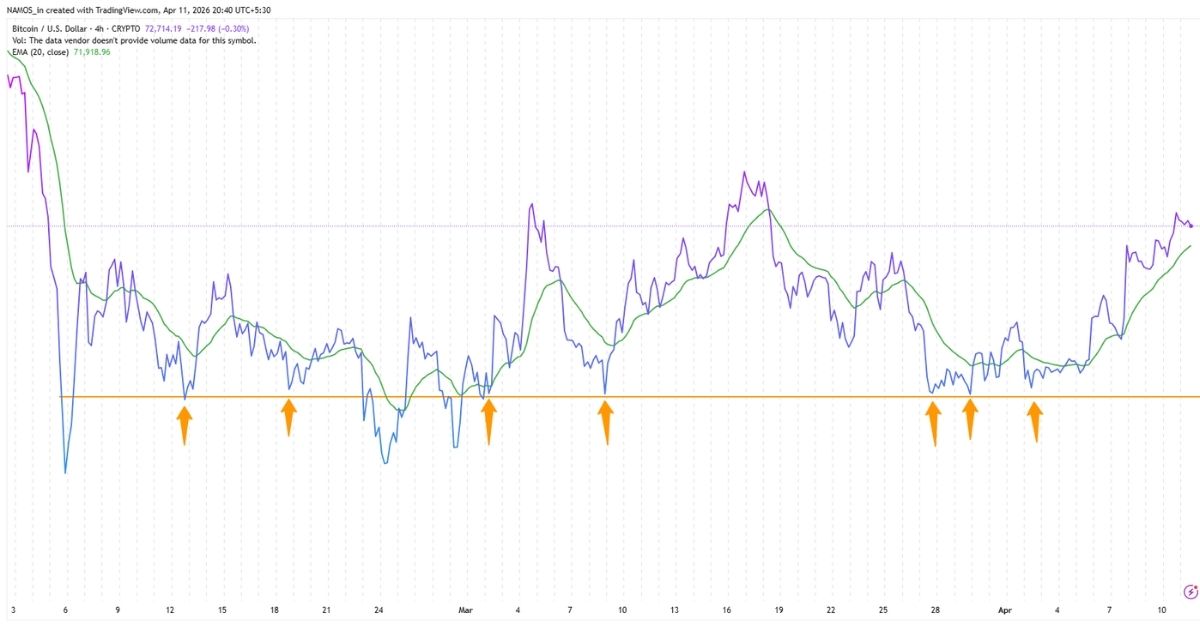
In this example, resistance is shown using a candlestick chart, so you can understand how to draw levels using both line charts and candlestick charts. This gives you a clear visual idea of how support and resistance work in real trading.
How to Draw Support and Resistance Lines
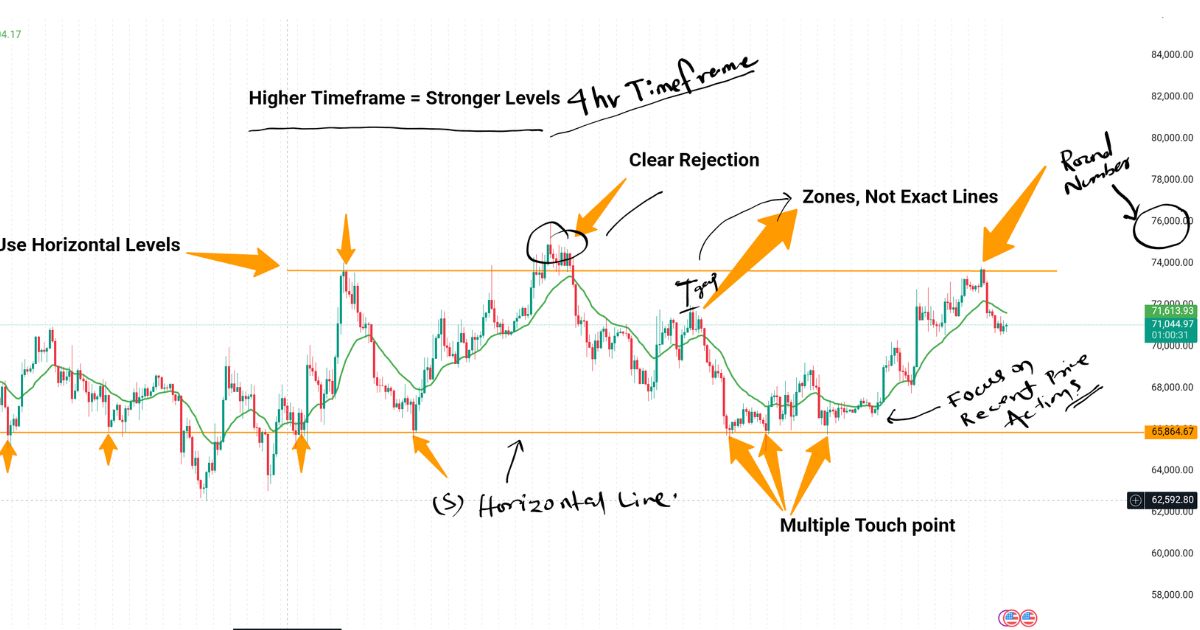
Multiple Touch Points: When a price touches a particular level two or more times based on historical price action, that level becomes important. We mark that point as support or resistance and draw a horizontal line accordingly.
Clear Rejection / Bounce: We observe where the price shows a strong buying reaction (bounce) from a level that becomes support. Similarly, where price shows a strong rejection and moves downward, that level is marked as resistance.
Use Horizontal Levels: We use horizontal lines because support and resistance are drawn at fixed price levels, which automatically form a straight line. Always draw a horizontal line on the points you have marked, instead of using slanted or trend lines.
Zones, Not Exact Lines: Do not focus on a single exact price level. The points you mark will usually be slightly above or below each other, which is normal. That’s why you should treat it as a zone (area) and draw your line based on that zone.
Prefer Line Chart for Clarity: For drawing support and resistance, it is better to use a line chart because it shows clear price levels without noise. Candlestick charts can be used for confirmation, but they may look slightly confusing at first. If you are a beginner, start with a line chart. As you gain experience, you can comfortably use candlestick charts along with it.
Higher Timeframe = Stronger Levels: If you are doing scalping, you can mark support and resistance on lower timeframes like 15 min or 30 min. But if you are doing intraday or swing trading, it is better to use higher timeframes like 1 hour, 4 hours, or daily. Levels formed on higher timeframes are usually stronger and more reliable, and you can use them on lower timeframes for better accuracy.
Volume Confirmation: Levels where volume is high are considered stronger because they show real participation from buyers or sellers. Whether it’s support or resistance, always give more importance to levels where volume increases, as it confirms the strength of that zone
Focus on Recent Price Action: It is always better to draw support and resistance based on recent price action. Recent levels (like the last 5–10 days) are more relevant and effective compared to very old levels (15–20 days or more). Old levels can still be considered, but they are usually less reliable than fresh market reactions.
Round Number / Psychological Levels: Some price levels naturally become important because they are round numbers, such as ₹100, ₹500, ₹1000, or ₹25,000. At these levels, the market often takes support or faces resistance multiple times, because traders psychologically react to these numbers. That’s why these are called psychological support and resistance levels; they should always be considered when drawing levels.
Role Reversal Concept: In the market, once a resistance level is broken, it often becomes a new support, and similarly, a broken support can turn into resistance. After the breakout, the market usually creates a new resistance level and continues moving between support and resistance. This is how the market naturally behaves—constantly shifting between these levels.
Types of Support and Resistance
Horizontal Support & Resistance
The most common type, where levels are drawn as straight horizontal lines based on repeated price reactions.
Trendline Support & Resistance
These are sloping lines drawn along higher lows (uptrend) or lower highs (downtrend) to identify dynamic levels.
Moving Average Support & Resistance
Indicators like EMA/SMA act as dynamic support or resistance where the price often reacts.
Previous High & Low Levels
Important past highs and lows act as strong support or resistance zones
Support and Resistance Formula
There is no exact formula for basic support and resistance, but traders often use Pivot Point formulas to calculate levels mathematically:
Pivot Point (PP)
PP = (High + Low + Close) / 3
Support Levels
S1 = (2 × PP) − High
S2 = PP − (High − Low)
Resistance Levels
R1 = (2 × PP) − Low
R2 = PP + (High − Low)
Simple Thought:
Manual S&R = Based on price action.
Formula S&R = Based on calculations.
Support and Resistance Indicators
Moving Averages (EMA/SMA)
Popular indicators like 20 EMA, 50 EMA, or 200 EMA act as dynamic support and resistance, where price often reacts.
Pivot Points
Automatically calculate support and resistance levels based on previous price data, useful for intraday trading.
Fibonacci Retracement
Helps identify key levels like 38.2%, 50%, 61.8%, where price may take support or resistance.
Bollinger Bands
The upper band acts as resistance, and the lower band acts as support.
Volume Profile
Shows price levels where maximum trading activity happened, indicating strong support/resistance zones.
RSI Indicator Explained – Best Settings, Strategies, Formula and How to Use
Which Candles to Consider for Support & Resistance
Swing High & Swing Low Candles
Always focus on candles where the price clearly reverses.
- SwingSwing Low = Support
- Swing High = Resistance High = Resistance
Rejection Candles (Wicks)
Candles with long upper or lower wicks show strong rejection.
- Lower wick = Buying (Support)
- Upper wick = Selling (Resistance)
Conclusion
Support and resistance are two of the most powerful and practical concepts in trading. They are not just lines, but important price zones where the market reacts again and again because of buyer and seller activity. By understanding how price behaves at these levels, traders can make better entry, exit, and stop loss decisions.
We learned that strong levels are formed by multiple touches, clear rejection, volume, and recent price action, and higher timeframes make them more reliable. We also saw that support and resistance can change their roles after breakouts and can be confirmed using indicators.