

In the previous trading sessions, gold was moving in a sideways trend. Currently, gold is trading at $4615, which is down by 66 points (-1.46%) at the time of writing this article. For now, the key support level is at $4616, while the resistance level stands at $4848.
Gold Price Analysis
In the previous trading sessions, gold was moving in a sideways trend. Currently, gold is trading at $4615, down by 66 points (-1.46%) at the time of writing. The key support level is $4616, while the resistance stands at $4848.
Due to ongoing tensions in the Middle East and concerns around the Strait of Hormuz, liquidity in gold has been unstable. Because of this, gold has been trading in a range over the past few days. However, price is now standing at a very important zone, making the next move crucial.
Gold Technical Analysis
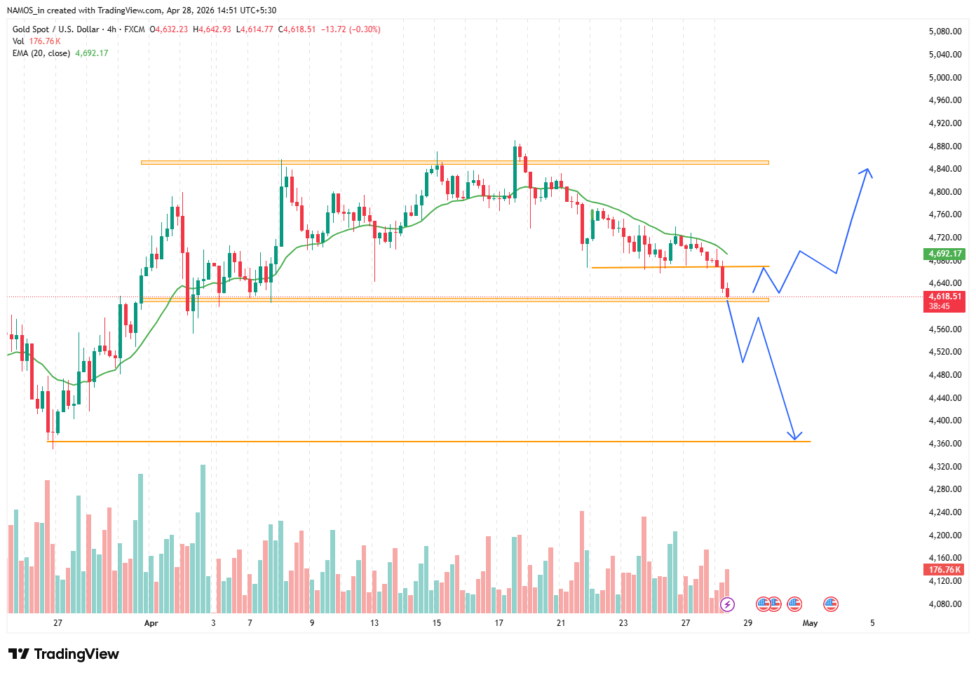
From a clear perspective, the current level is acting as a strong support zone, and the price is attempting to break it.
On the daily timeframe, gold is trading below the 20 EMA, which indicates strong selling pressure. This means the market is currently under the control of sellers.
If the price breaks below $4632, the next downside target could be around $4360. However, if the price fails to break this support zone, gold may continue to move within a sideways range.
On the 4-hour timeframe, the RSI is at 36, showing weak momentum and bearish sentiment.
On the 1-hour timeframe, a clear downtrend structure is visible. The latest candle has closed in red below the 20 EMA, and the RSI is around 33, confirming short-term bearish pressure.
Bearish Scenario:
If the price breaks below $4632, the next downside target could be around $4360.
Sideways Scenario:
If the support zone holds, gold may continue to move within a sideways range.
I have clearly shown this setup in the chart. So you can take visual confirmation from the image.
#goldprice